Designing a Project Status Dashboard
Role
Product Designer
Team
Senior Product Manager
Product Management Intern
Engineering Lead
Timeframe
4 weeks
Skills
User Interviews
Personas
Wireframing
Prototyping
UI/UX Design
CONTEXT
Project overview
Setting the scene
In a digital agency, day-to-day collaboration involves both internal teams and external clients. At TribalScale, teams manage multiple projects and their progress, health, and decisions, relying on a mix of tools like Jira, Runn, Excel, and Email. This fragmented workflow sometimes leads to communication gaps, misalignment, and extra effort just to stay on the same page.

Goal
Our goal was to design a centralized project dashboard that brings together essential data from existing tools into one intuitive interface, improving visibility across project stages with information tailored to different user roles.
FINAL DESIGNS
Designing the final solution
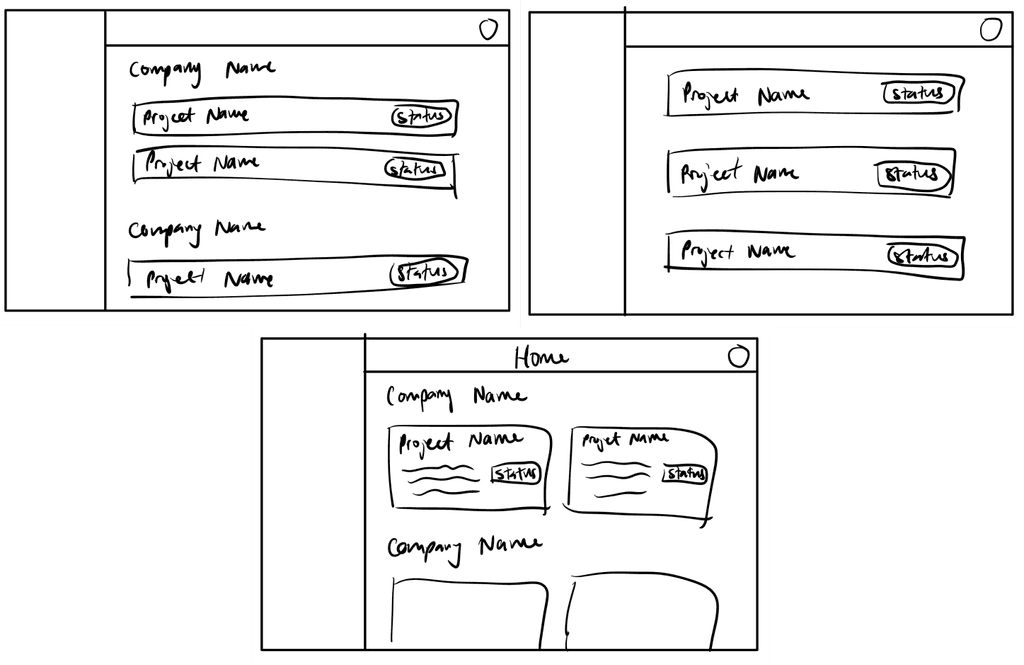
Home page and viewing a project
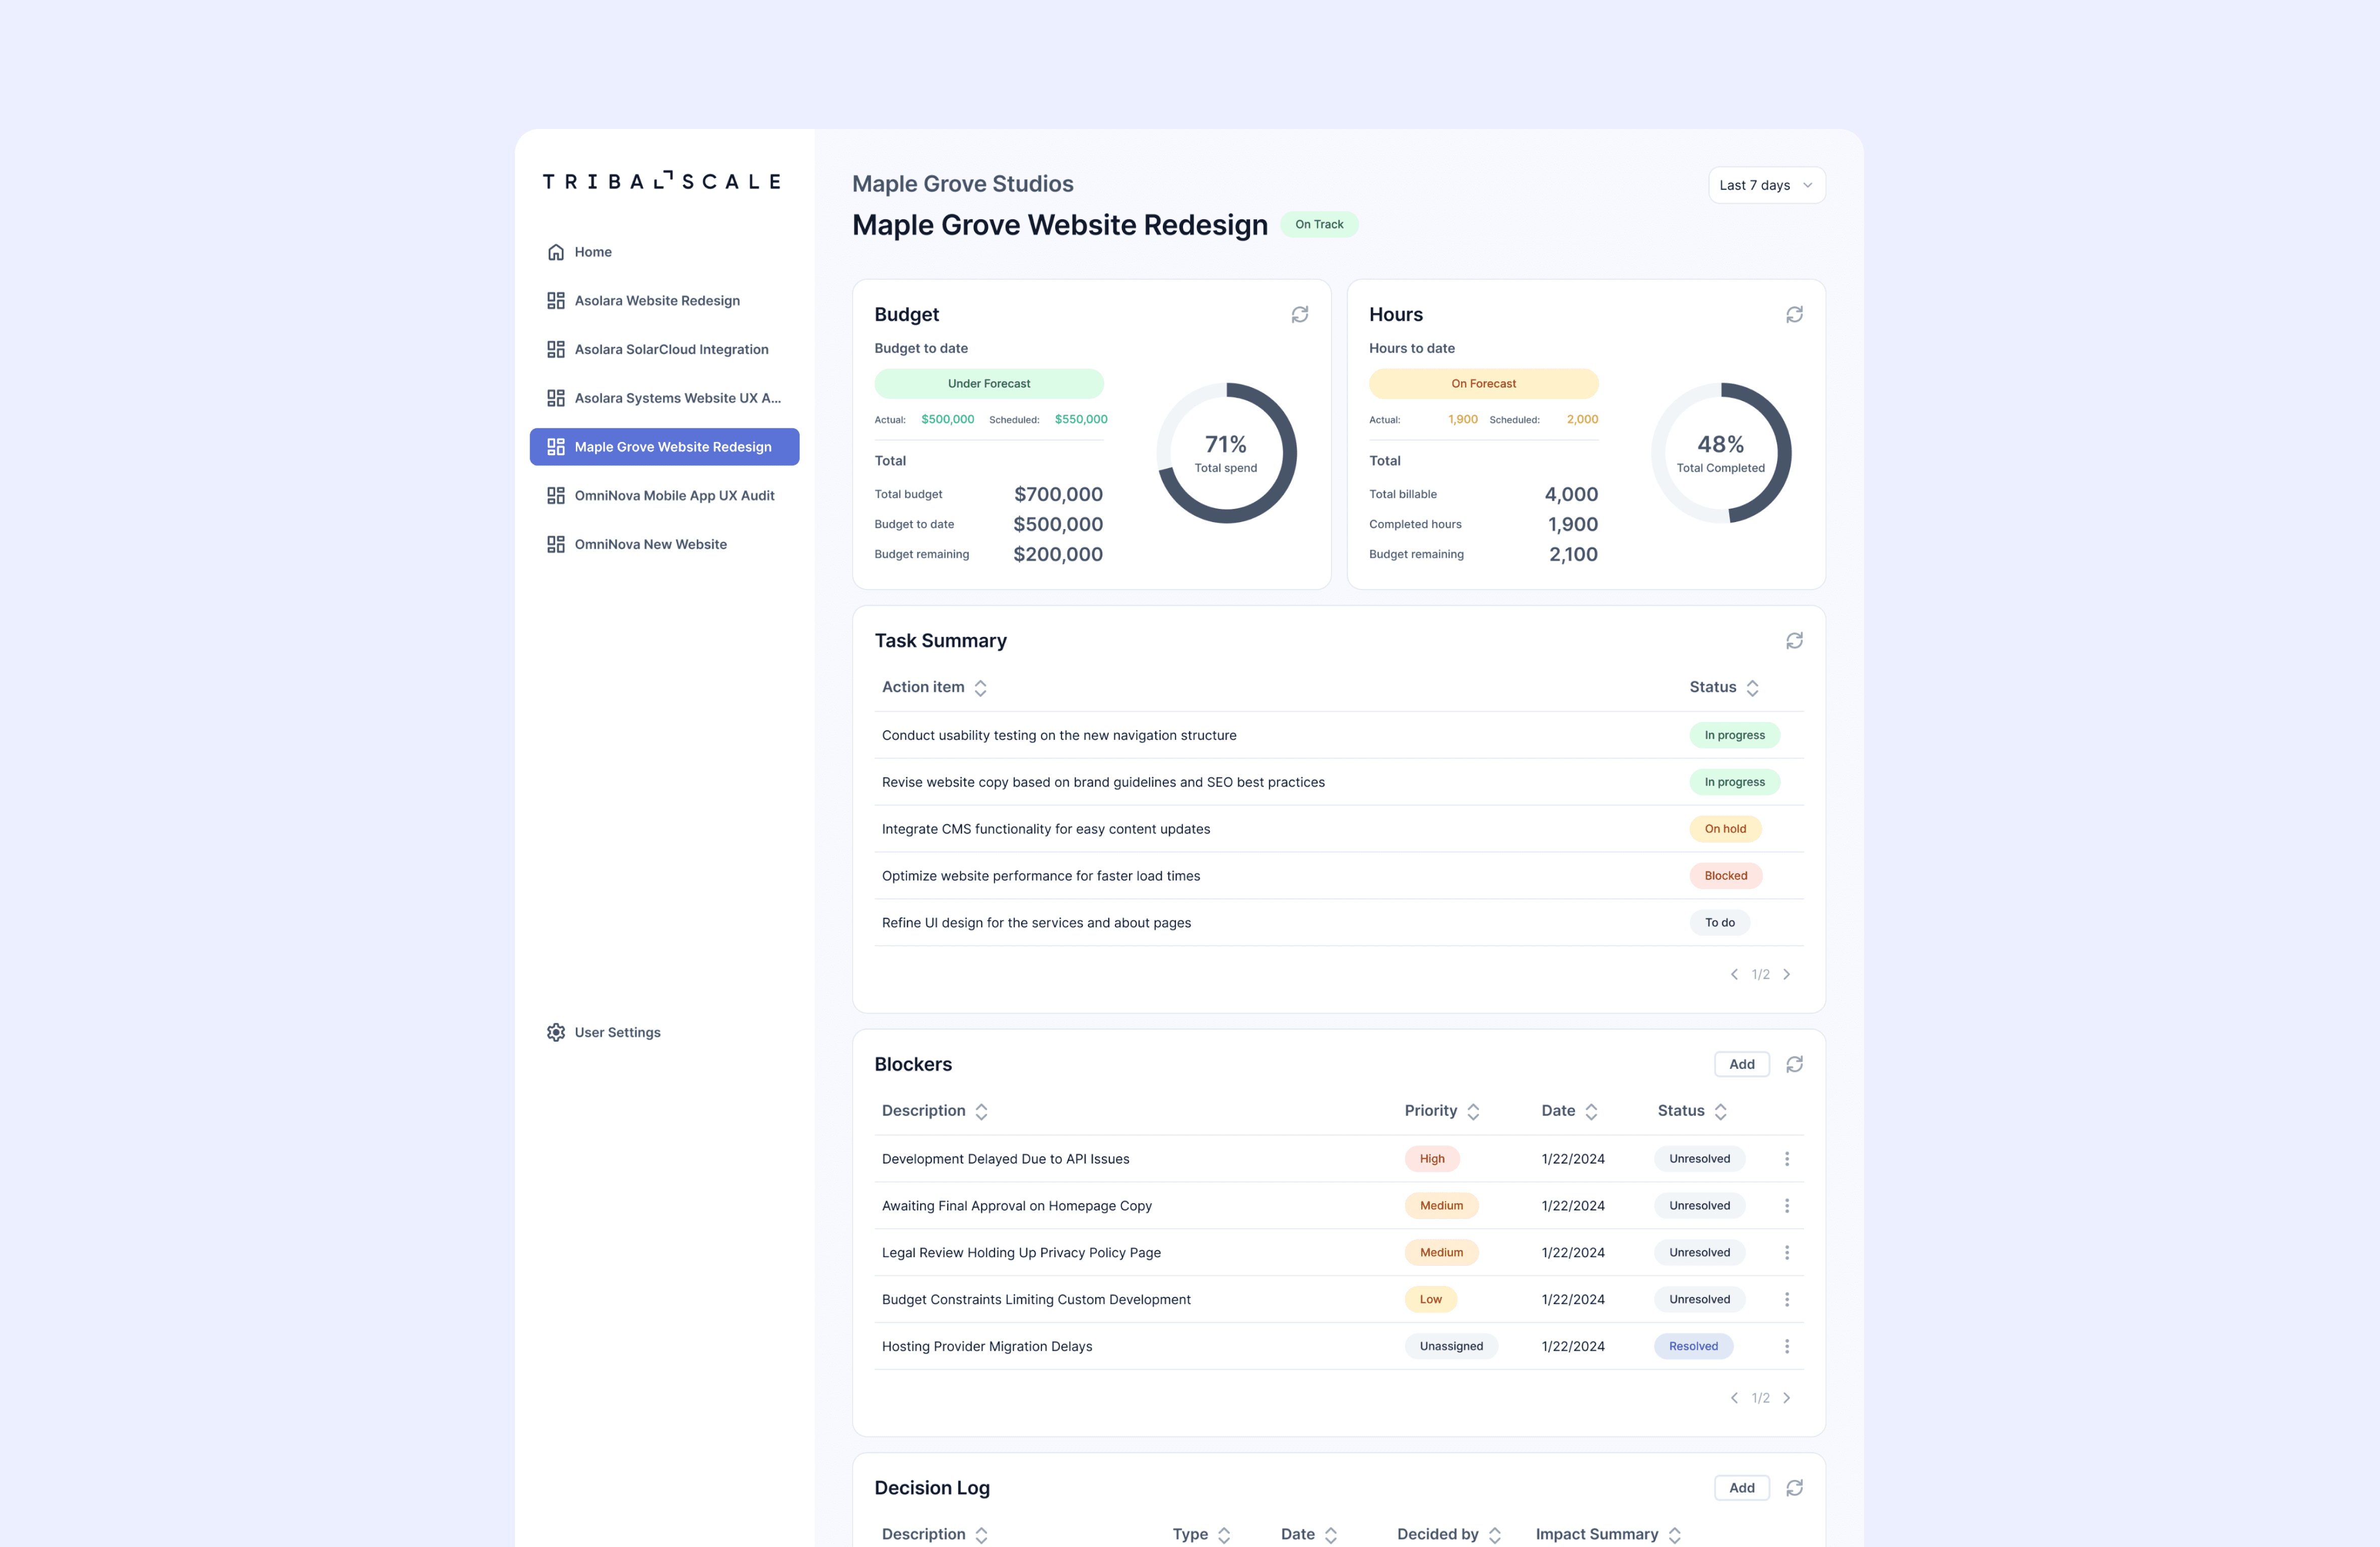
The home page displays all of a user's projects, providing a high-level overview of their status and quick access to each project dashboard. Within a project dashboard, users see a customized set of widgets based on their role.
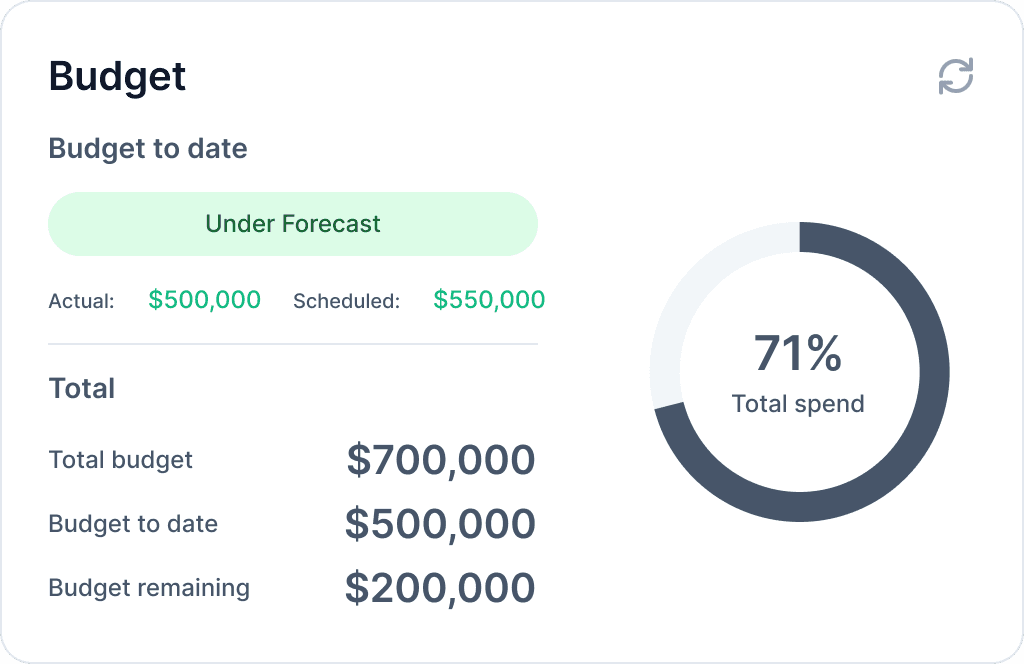
Data-focused widgets
These widgets provide a high-level overview of a project's budget, profitability, and hours spent to date. I combined all three into a single design to maintain consistency and reduce development effort. The widget uses color indicators: green for under forecast, yellow for within 5%, and red for over forecast.
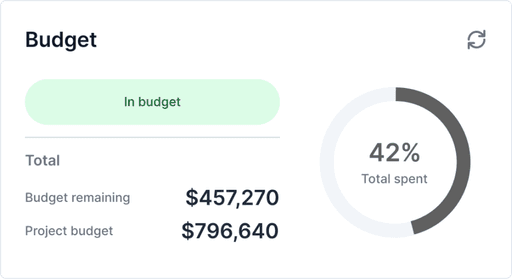
Budget
Shown on Client Team accounts
Shows the client how much they’ve spent, forecasted budget to date, and remaining budget
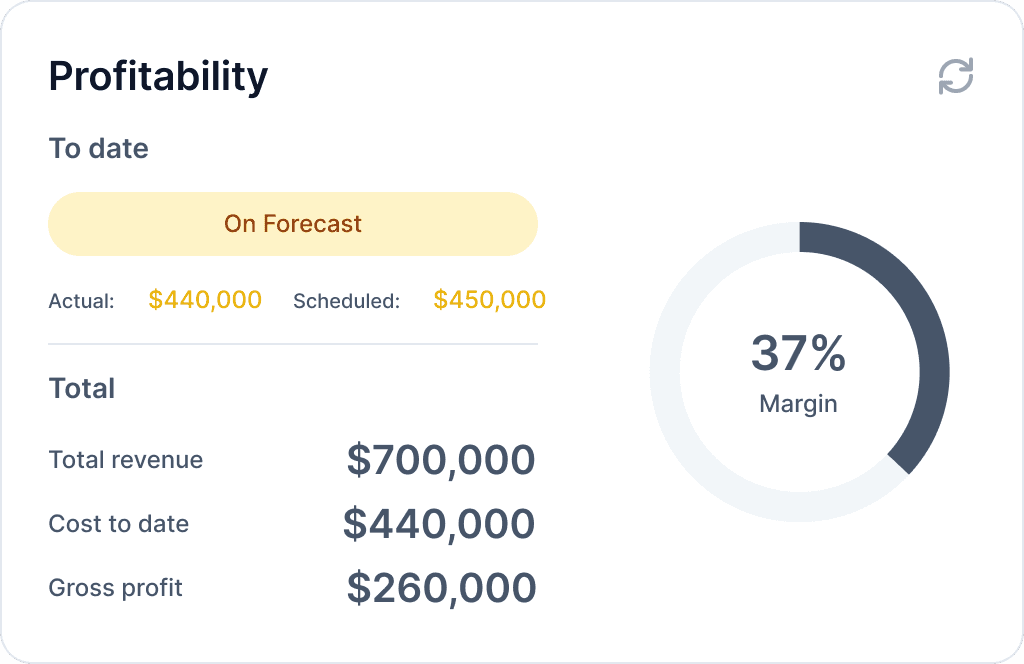
Profitability
Shown on Internal Team accounts
Shows the internal team how much the project is costing and how profitable it is
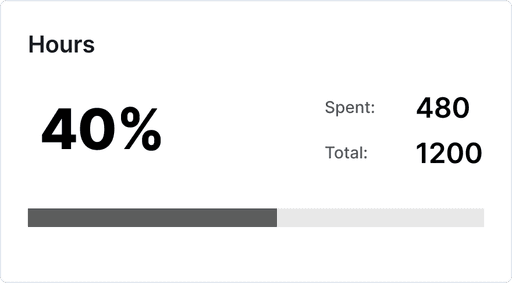
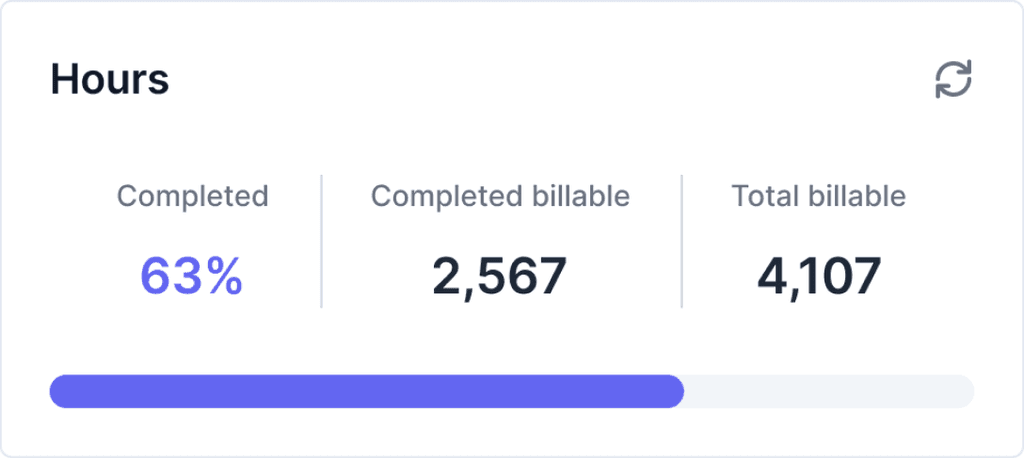
Hours
Shown on all users accounts
Shows all teams how many hours are allocated to the project as well as hours completed and remaining
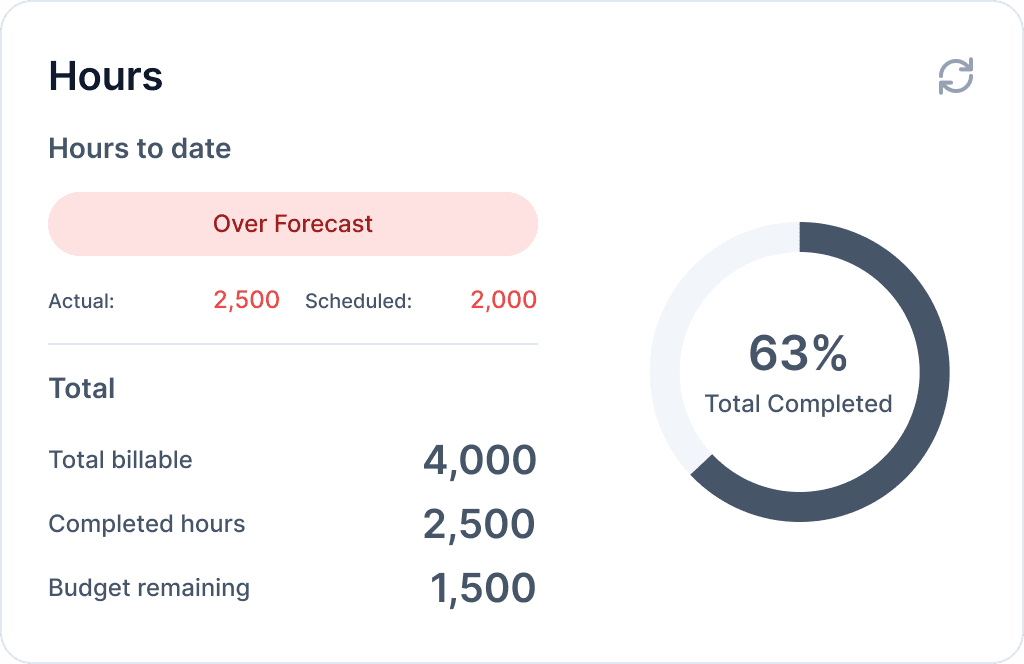
Table widgets
The Task Summary, Blockers, and Decision Log widgets show key project updates in a structured table format, each displaying relevant information.

Viewing widget details
Users can click on individual rows within table widgets to view more detailed information.

Adding to a manual-entry widget
For widgets that don’t sync with external platforms, users with admin permissions can manually add relevant information directly to the widget.
Creating a new project
Users with admin permissions can create a new project on the dashboard. During setup, they can link the relevant Jira board and Runn project to enable automatic syncing of information.
Now, taking a step back…
USER RESEARCH
Understand & empathize
User interviews
We started by conducting user interviews with members within the company and gathered insights on their current experiences. We talked to developers, product managers. team leads, and the CFO, to understand the pain points of various roles. Then, I analyzed these insights to help guide the next stages of the design process.

Pain points
1.
Lack of clarity across teams
It's hard to get a clear picture of project progress. Updates are scattered, visibility is limited, and teams aren’t always on the same page.
2.
Too many tools to track project status
Project information lives across Jira, Runn, spreadsheets, and email. Checking them all takes time and adds friction to staying up to date.
3.
Adding steps to track progress is tedious
Teams don’t want to add unnecessary tedious work just to stay on track. Tracking progress shouldn't create more work than doing the actual work.
Target user groups
Based on our research, we focused on four target user groups.
Client - Product Team
Product Managers, Team Leads, Developers, Designers, Analysts
Internal - Product Team
Product Managers, Team Leads, Developers, Designers, Analysts
Client - Executive Team
C-suite level (CEO, CPO, CFO, CRO, COO)
Internal - Executive Team
C-suite level (CEO, CPO, CFO, CRO, COO)
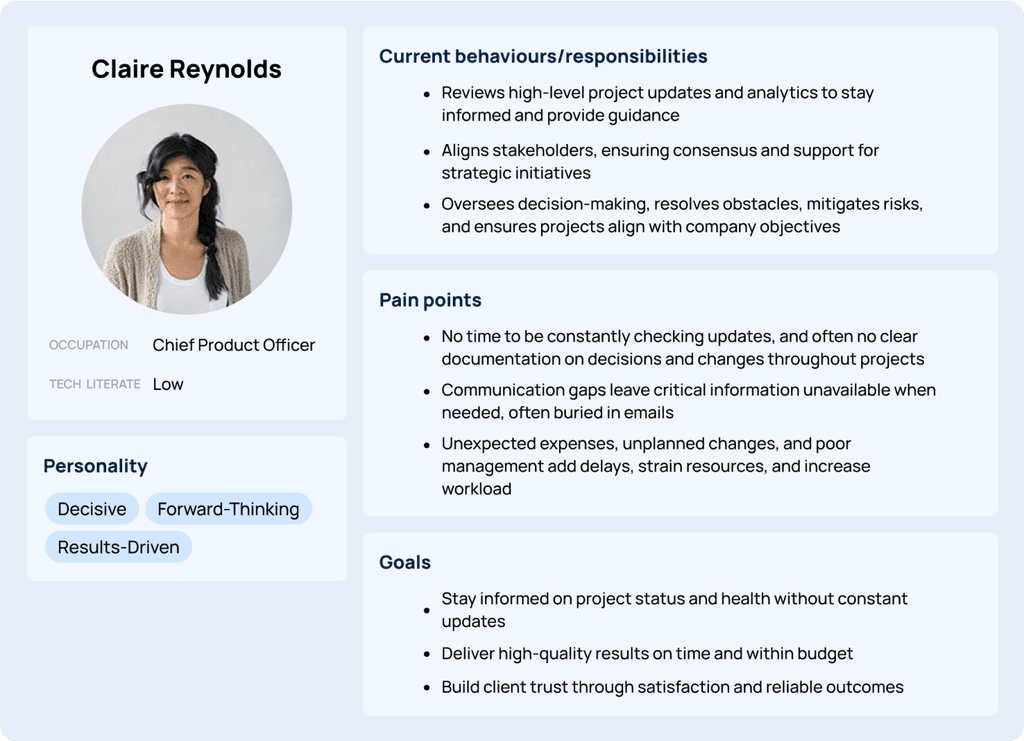
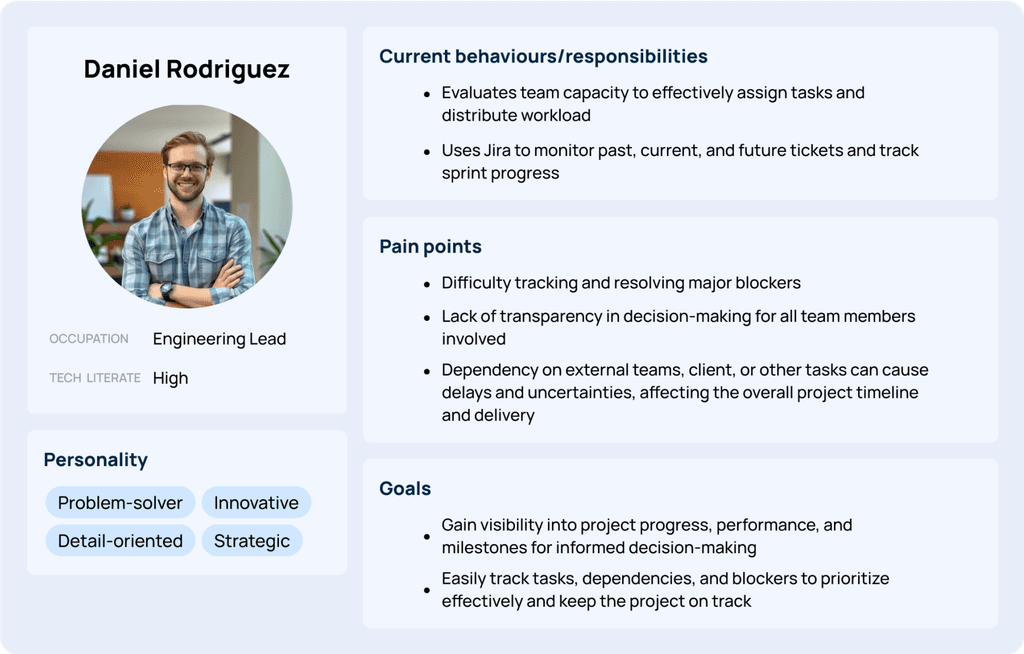
Personas
I created personas for the executive level and product level to understand their respective pain points and goals. Understanding these personas helped in understanding the different perspectives, and also showed the team and stakeholders who we were designing for.
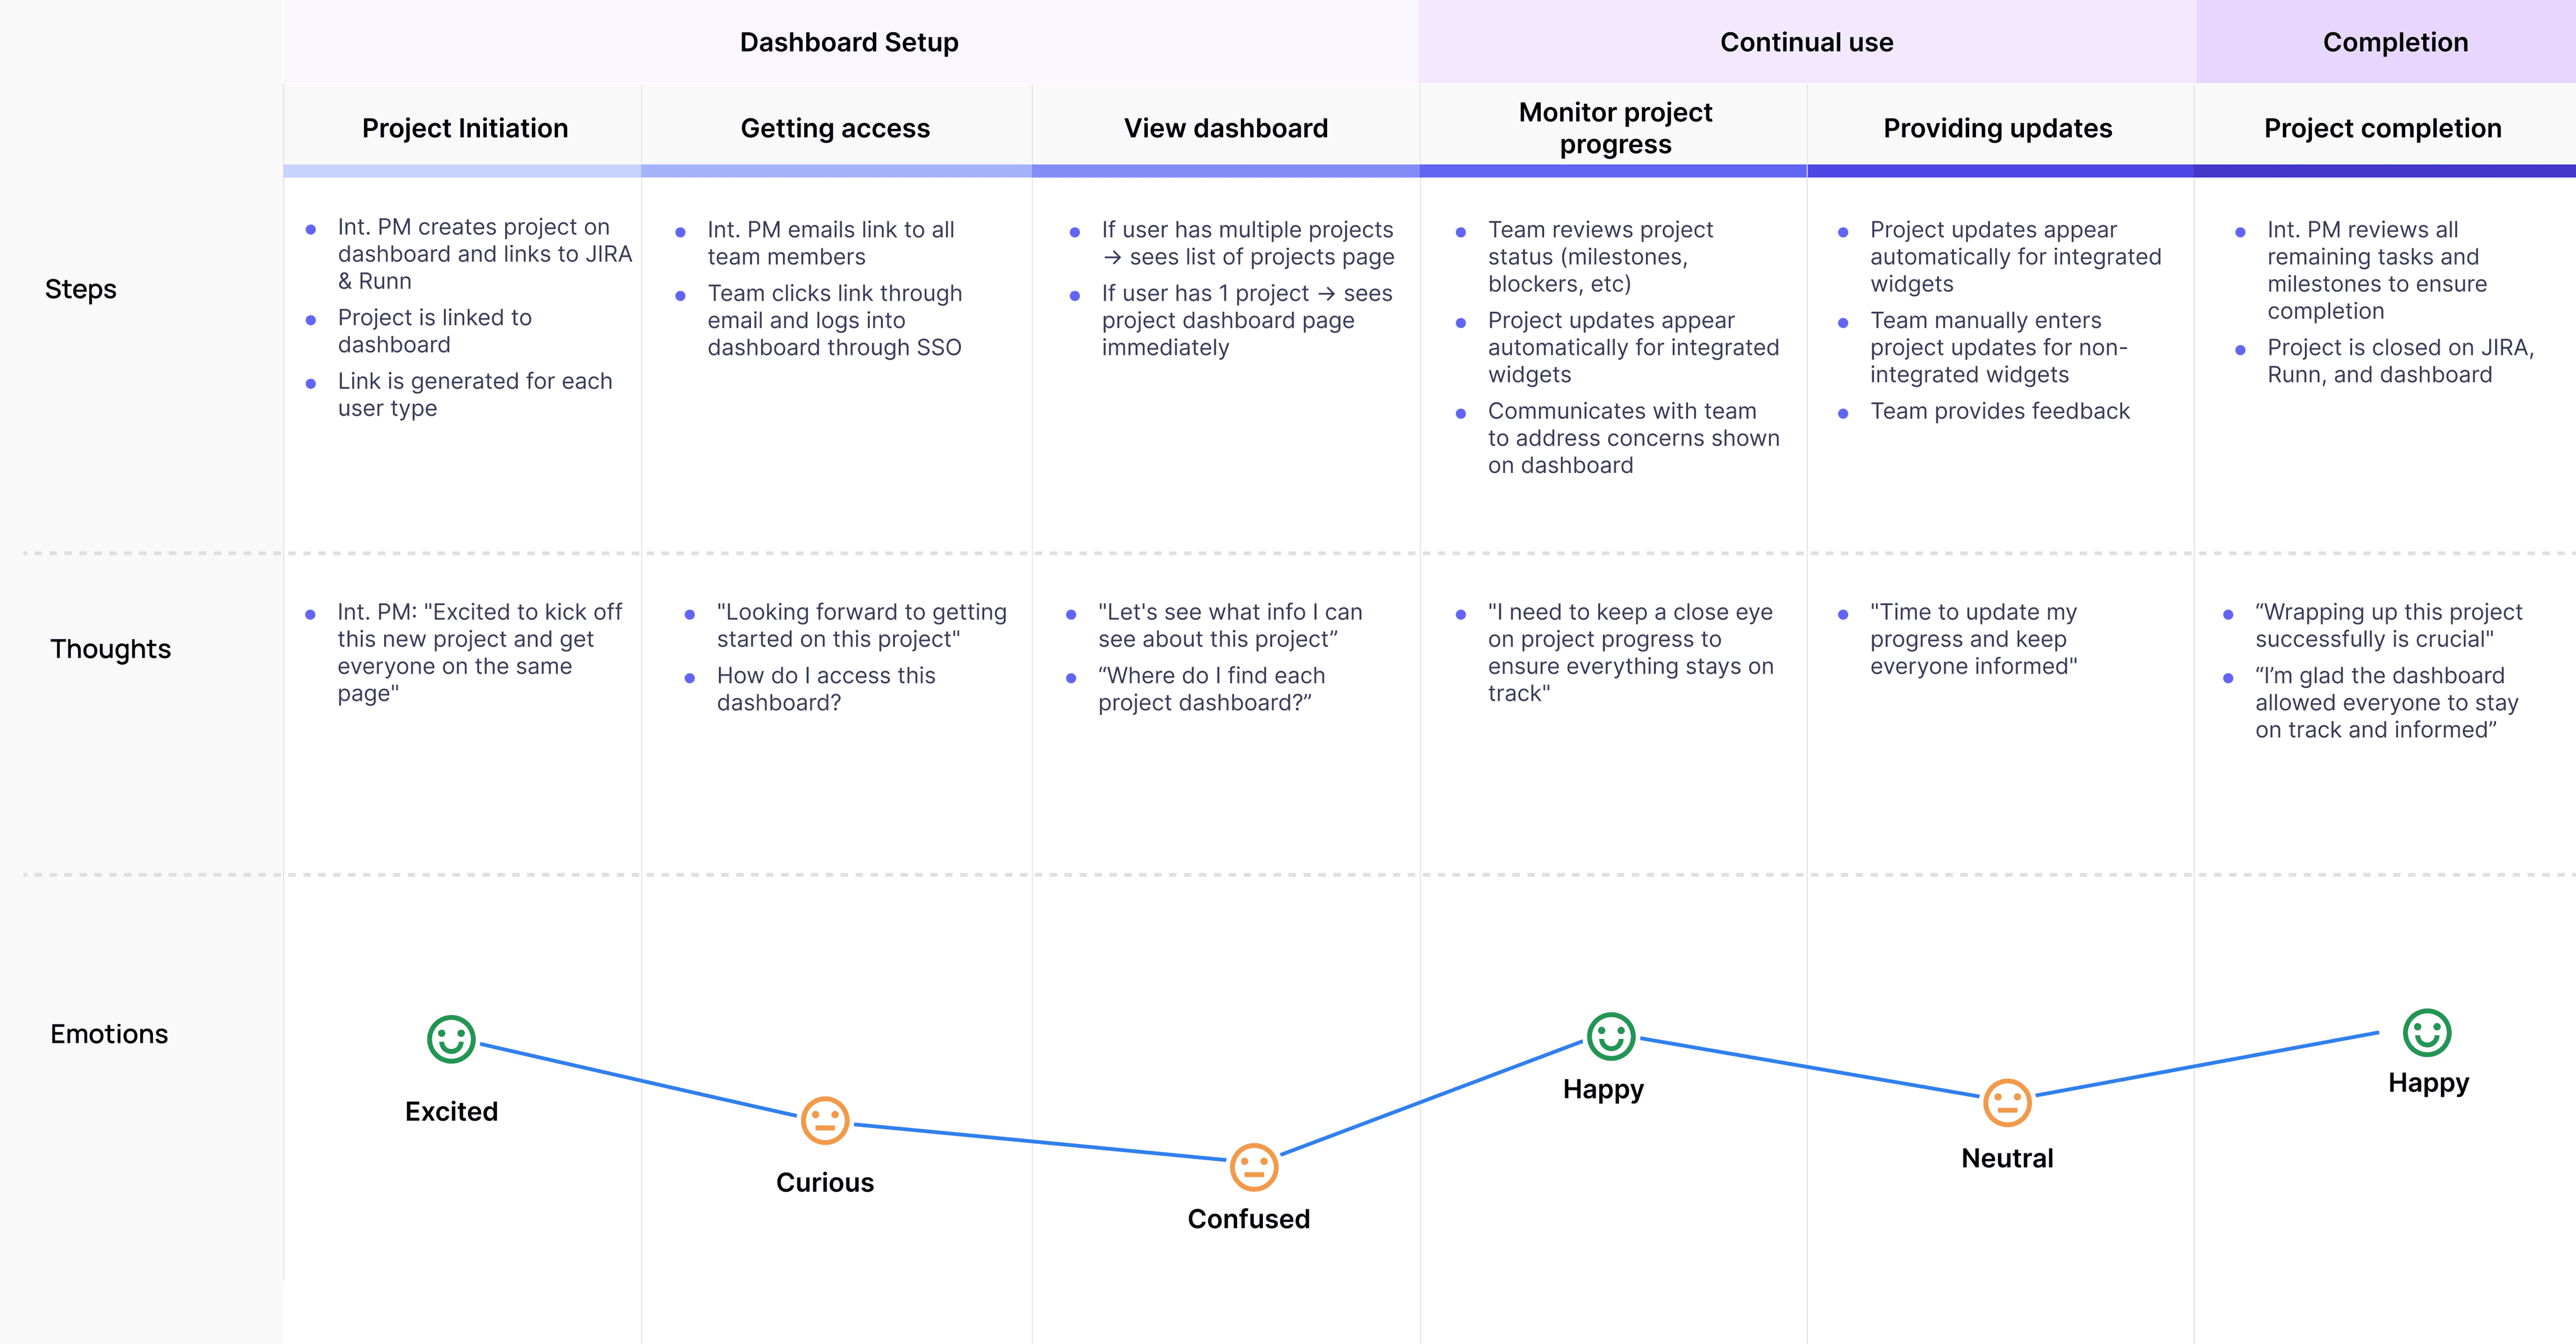
User journey map
I created a user journey map to give the team a holistic view of how the dashboard would be used from the start to the end of a project, helping align around key pain points and opportunities.
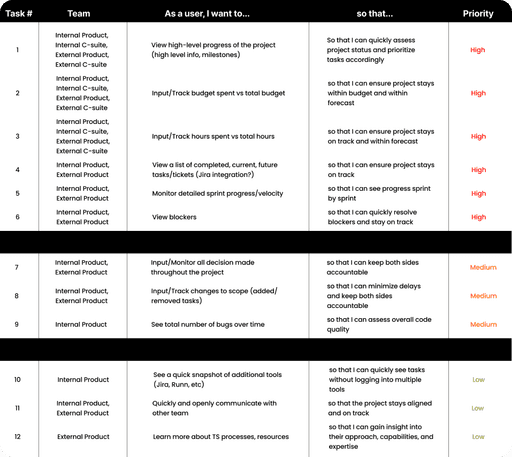
User stories prioritization
I began by writing user stories that reflected the needs uncovered during research. Each story was tagged with the relevant personas to highlight who it served.
We then held a prioritization workshop with the team, ranking stories based on how many personas they impacted and team input, helping us focus on the most valuable widgets for the MVP.
IDEATION
Brainstorming designs
Early sketches
I began with rough sketches to quickly explore ideas for the overall dashboard layout, using existing dashboards as references to understand common patterns.
Home page
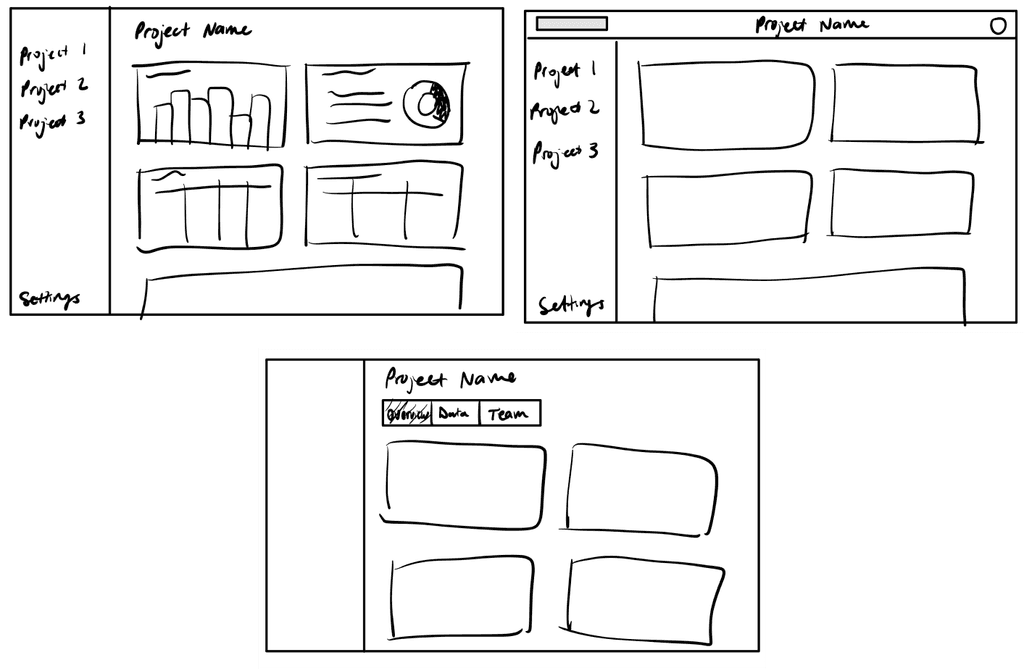
Project page
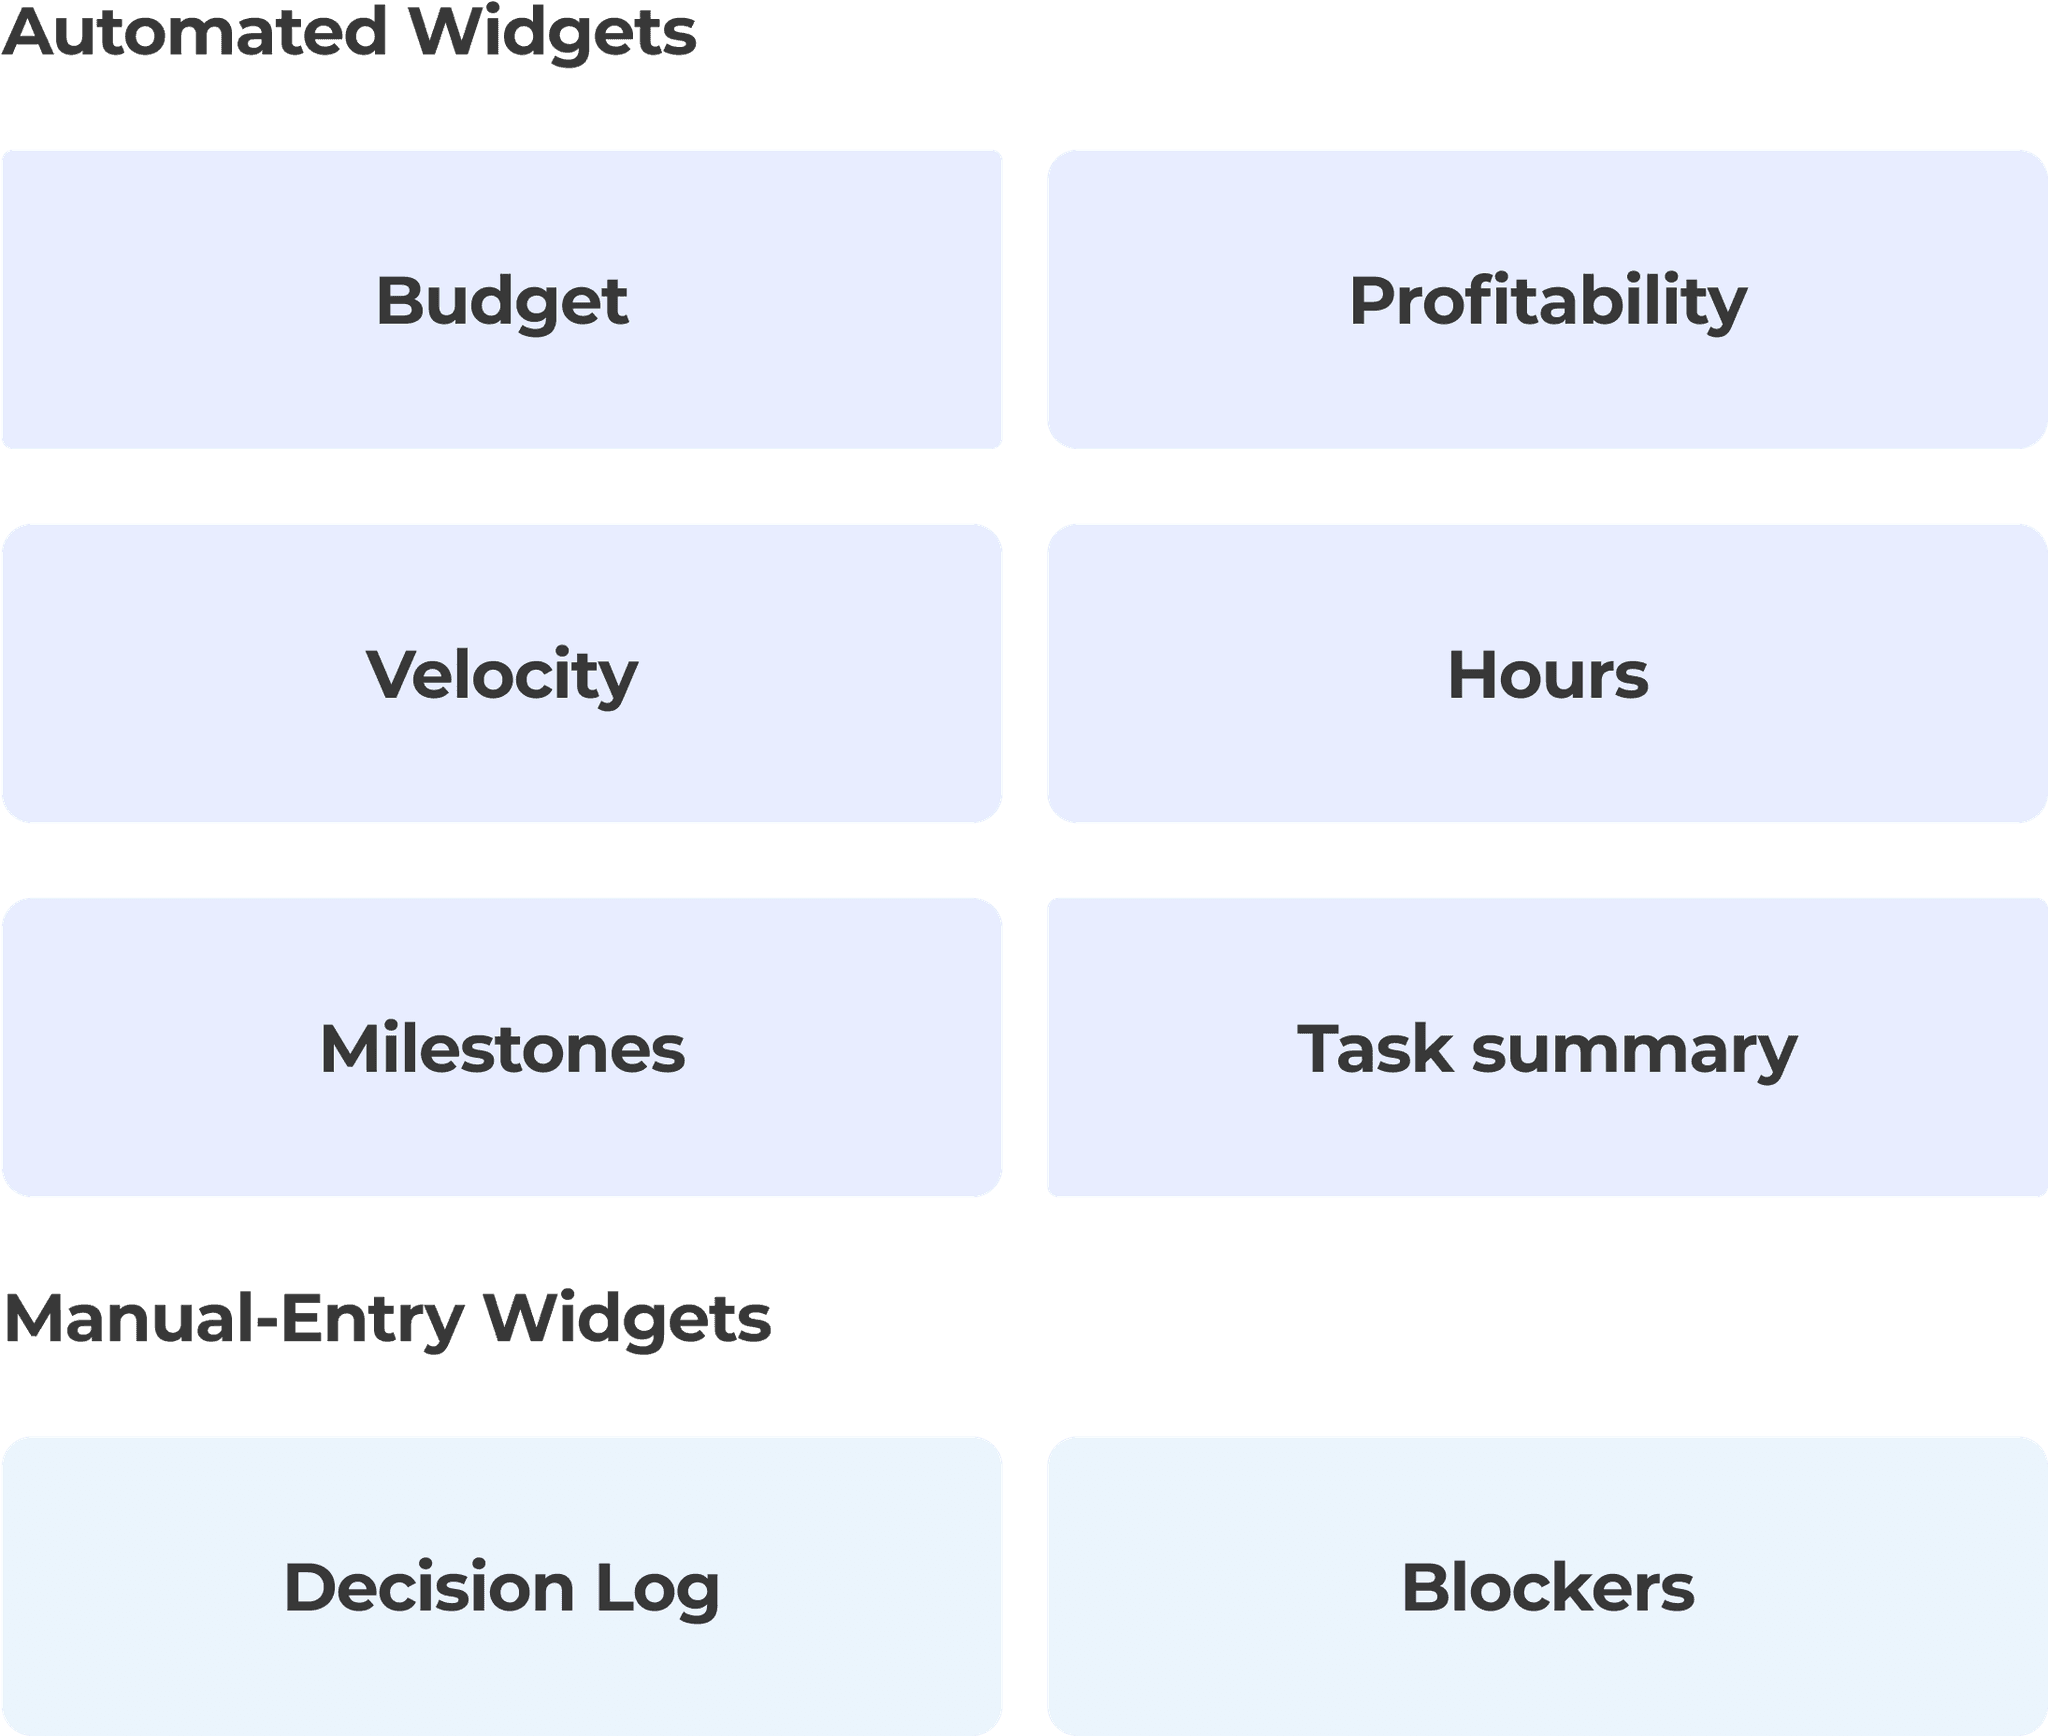
Automated or manual-entry widgets?
I took the user stories from the research phase to correspond to a widget on the dashboard. Referencing back to our goal, we wanted to make sure this dashboard didn't add more work to track project information and wanted it as automated as possible, pulling information from tools we already use. Collaborating with the engineering lead and the PM, we went through each widget and determined what was feasible and what information was available.
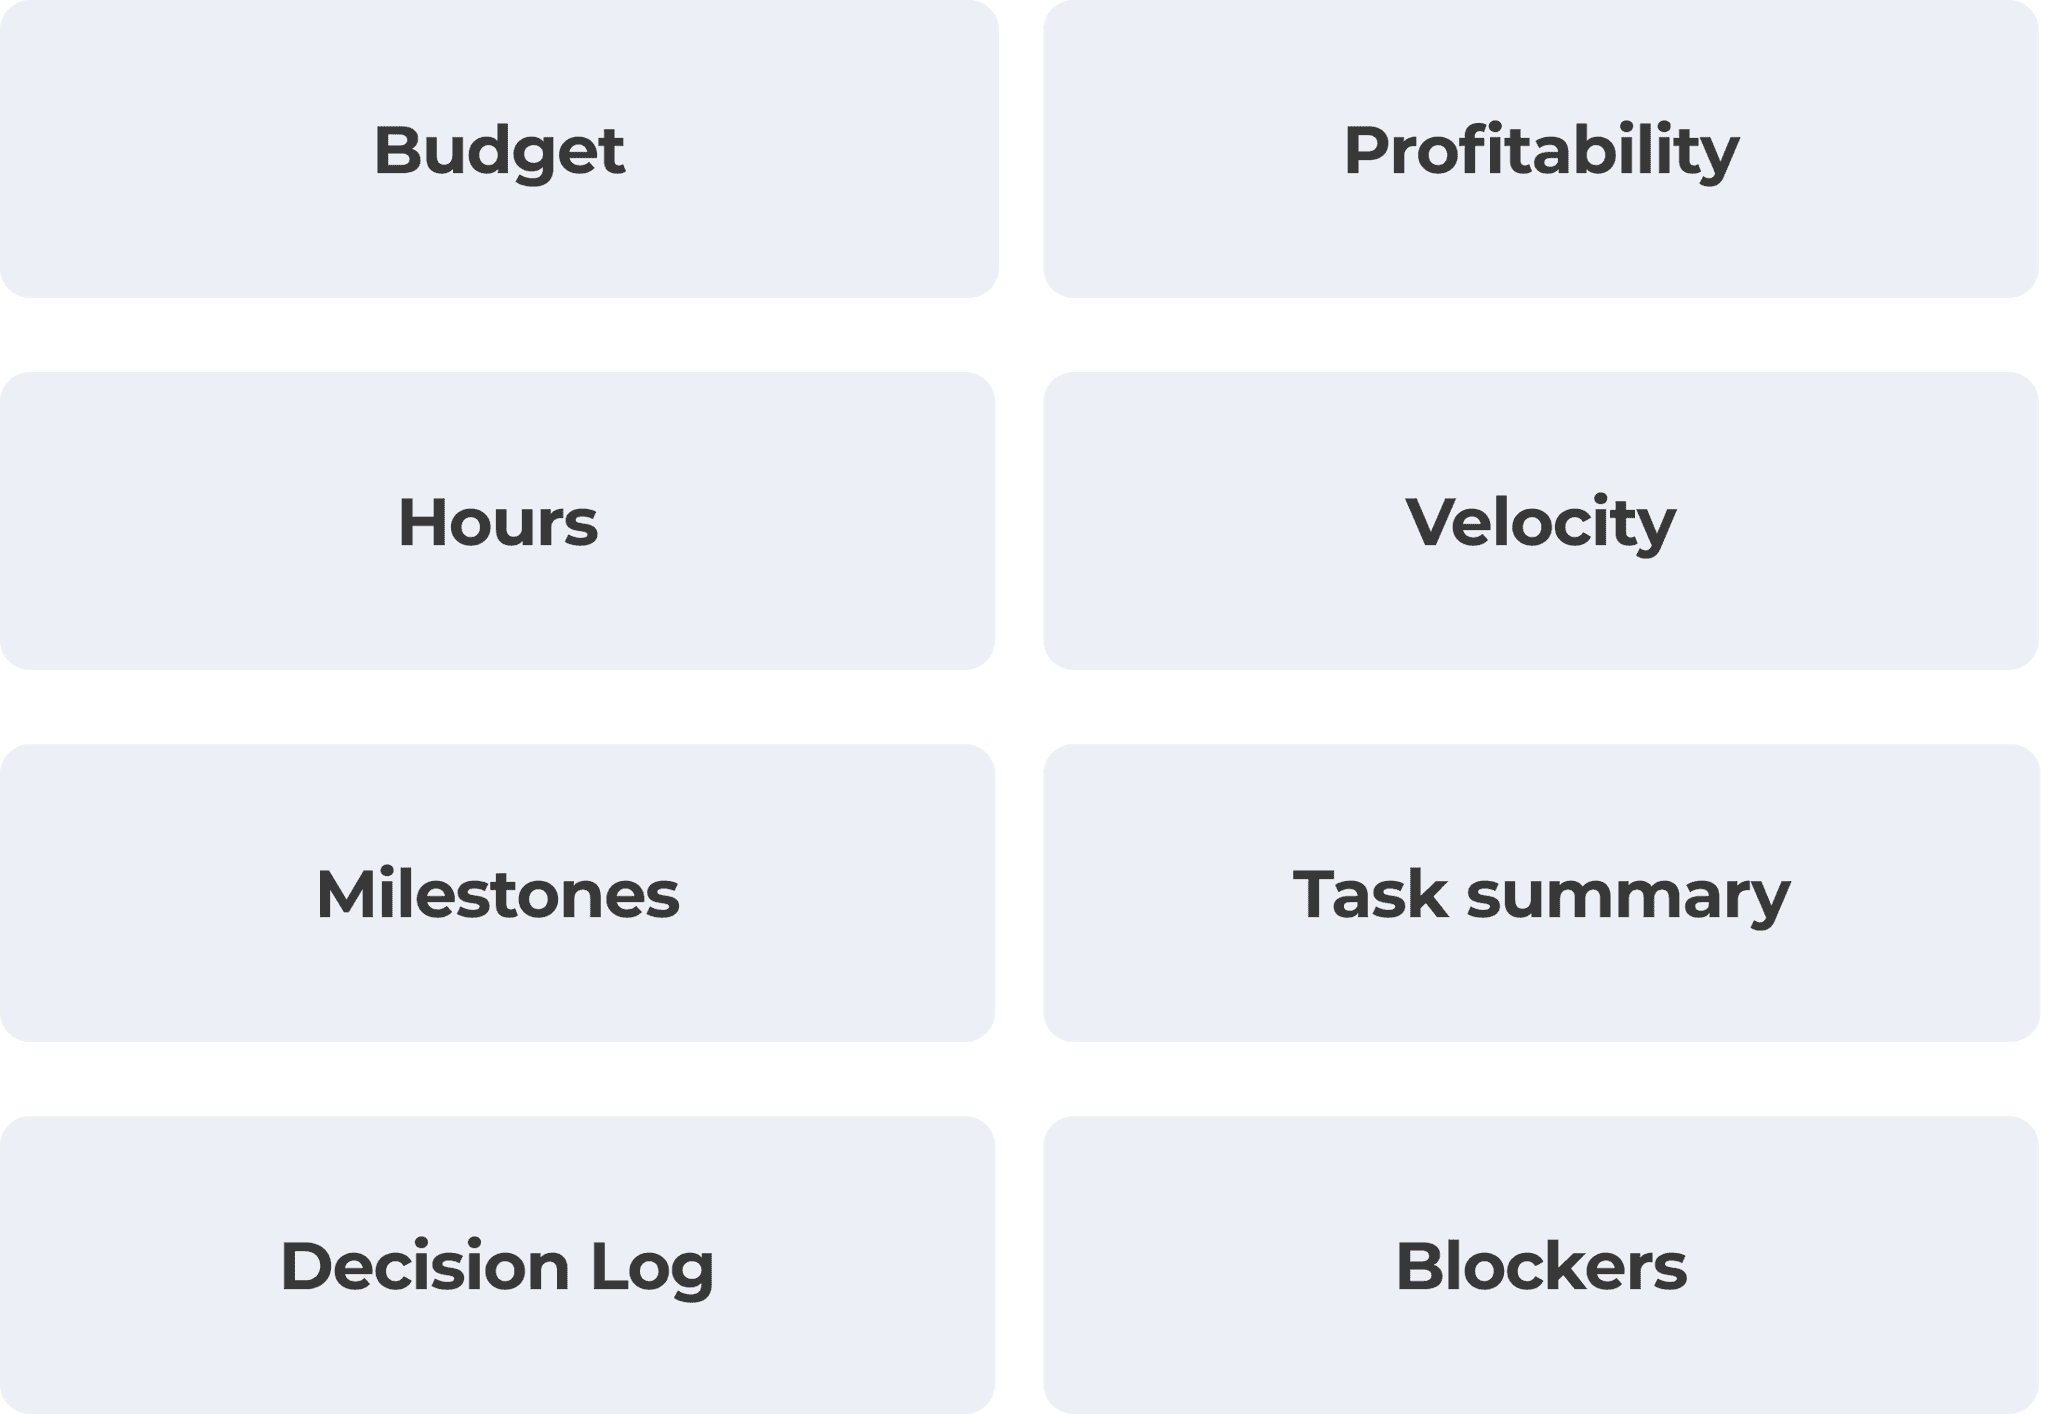
Widget ideation
Once the widget types were finalized, I explored various layout and interaction ideas for both automated and manual-entry widgets.
Automated widgets
Manual-entry widgets

Add directly to the widget, similar to Google Sheets behaviour
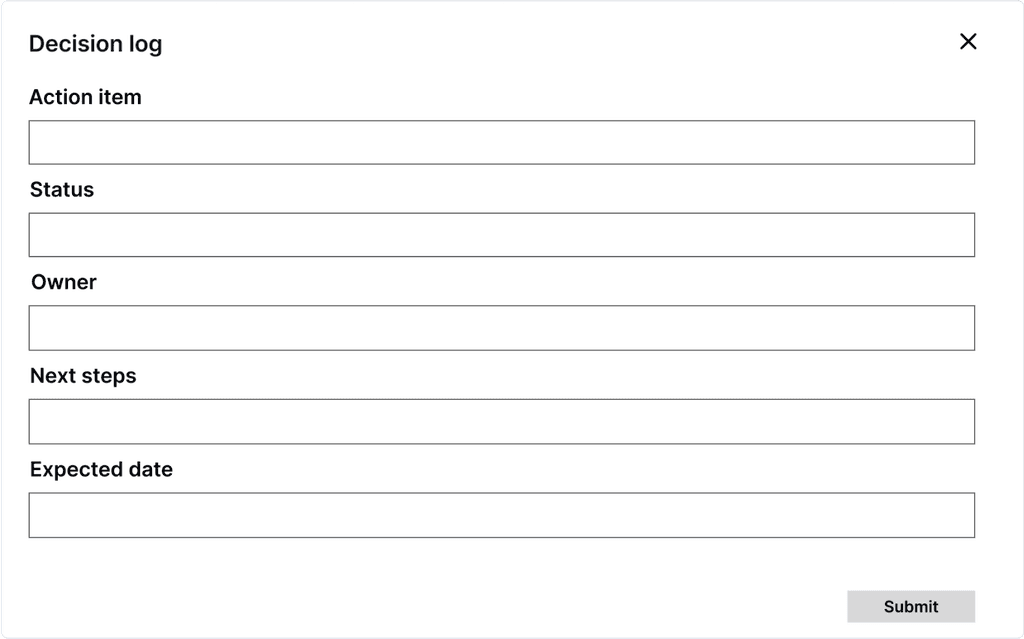
Modal opens with different input fields
RETROSPECT
Reflections
Potential next steps
If I had the opportunity, I would have focused on the following:
Validate and iterate on designs by conducting user testing with both internal and client-side users
Conduct user research with the client side to better understand their pain points and behaviours
Explore additional widgets that were deprioritized for the MVP
What I learned
How to work cross-functionally by collaborating closely with product managers and engineering to understand the project scope, technical limitations, and business goals
Balancing ideal solutions with technical constraints by aligning closely with engineering
Adapting under change and navigating a fast-paced environment by staying flexible and focusing on impact

